Tools and Instrumentation
Apr 9, 2018 • gtelbaproject
milliMonitor
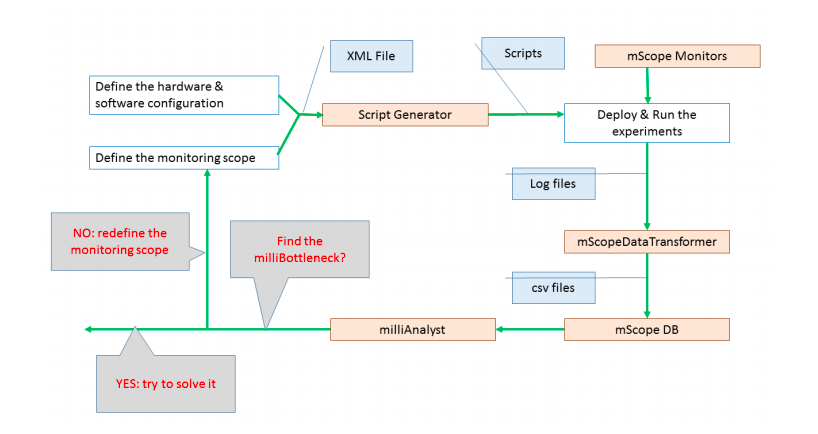
In the above graph, each component aligns with one of the phases of our pipeline.
-
Generate Experiment – specifies an experiment and generates artifacts
-
Execute Experiment – automatically provisions a cloud and deploys the artifacts
-
Analyze Experimental Data – automatically collects, parses and reasons the data
milliMonitor High Level Design
Templates & Script Generator
-
Aspect-oriented code generator
-
Specializes scripts, benchmark source code and configuration using XML-based spec.
mScope Monitors
-
Inject measurement schema into benchmark
-
Record identifier, timestamps and output in native benchmark logs
mScope Data Transformer, mScope DB
-
Ingest and normalize data from mScope monitors
-
Dynamic database to persist transformed data
milliAnalyst
-
Combines known millibottleneck mechanisms with data
-
Reduces millibottleneck identification and root cause isolation / determination into a longest path problem
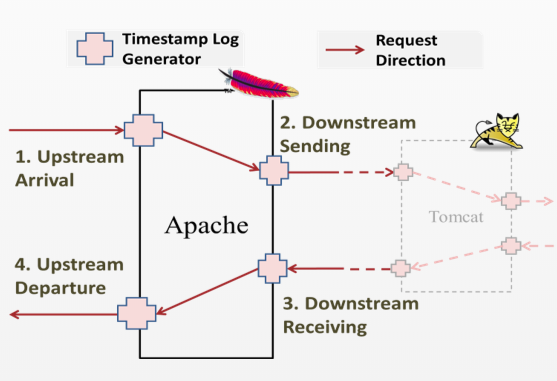
mScopeMonitors
Currently, we have implemented Apache, Tomcat, CJDBC, and Nginx event mScopeMonitors.
Each event mScopeMonitor records four timestamps for each request on each component, which can be used to rebuild the causal relationship.
Resource mScopeMonitors
Collectl: A monitor tool capable of recording system resource utilization, including CPU, memory, process runtime state, network and disk I/O at fine granularity (every 50ms).
SAR: collects, reports and saves system activity information (CPU, memory, disks, interrupts, network interfaces, TTY, kernel tables,etc.)
IOStat: reports CPU statistics and input/output statistics for devices, partitions and network filesystems.
Event Monitors
Emulab supports limited use of the NS at syntax, allowing you to define a static set of events in your NS file, to be delivered to agents running on your nodes. There is also “dynamic events” support that can be used to inject events into the system on the fly, say from a script running on users.emulab.net.
milliAnalyst
milliAnalyst is a uniform data interface consisting of three entities:
-
PointinTime
-
DownstreamServiceTime (DST)
-
ResourceObservations
Each of these entities can have a variable number of number of attributes. The number of nodes specified in the experiment determines the number of DST attributes. Also note that the number of attributes can also depend on characteristics that might not be known prior to running an experiment, such as a node’s number of CPUs, cores, NICs or disks.
The method needs to handle this variable number of attributes, i.e. there are no fixed schemas. The method also needs to be able to integrate data across time and space.
The representation needs to be able to handle data anomalies and support efficient filtering and retrieval of small data subsets across all of the measurements and support graph-based reasoning.